

Dota 2 Rank Percentiles 2026 by Region: What Top 10%, 5% and 1% Means in MMR

Top 10% in Dota 2 globally starts at approximately 3,800-4,200 MMR depending on your region. But that single global number is misleading — the same MMR means something very different in China versus South America. This guide gives you the exact MMR thresholds for top 10%, 5%, and 1% on every major server, sourced from Stratz and OpenDota community tracking data (mid-2026, ~7 million ranked accounts). All figures are approximate. Seasonal rank resets and major patches can shift thresholds by 100-200 MMR in either direction.
If you want to check where your MMR sits right now, use our Dota 2 MMR calculator to see your live percentile.
Contents
- Master Table: All Regions at a Glance
- Why Your Region Changes the Threshold
- EU Server Percentile Breakdown
- China (CN) Percentile Breakdown
- CIS Server Percentile Breakdown
- SEA Server Percentile Breakdown
- North America (NA) Percentile Breakdown
- South America (SA) Percentile Breakdown
- Middle East (ME) Percentile Breakdown
- How to Use These Numbers
- FAQ
Master Table: MMR Percentile Thresholds by Region (2026)
The table below shows what MMR you need to reach each percentile tier on each major server. Data is aggregated from Stratz and OpenDota community tracking, mid-2026. Figures carry a margin of roughly +-150 MMR depending on patch and season timing. See the full regional rank distribution for medal-by-medal breakdowns.
| Region | Top 10% (90th pct) | Top 5% (95th pct) | Top 1% (99th pct) | Approx. Medal |
|---|---|---|---|---|
| EU | ~4,000 MMR | ~4,800 MMR | ~6,400 MMR | Ancient 2 / Divine 2 / Immortal |
| CN | ~4,500 MMR | ~5,400 MMR | ~7,100 MMR | Ancient 5 / Divine 4 / Immortal |
| CIS | ~3,800 MMR | ~4,600 MMR | ~6,200 MMR | Ancient 1 / Divine 2 / Immortal |
| SEA | ~3,500 MMR | ~4,200 MMR | ~5,900 MMR | Archon 5 / Ancient 4 / Divine 5 |
| NA | ~3,300 MMR | ~4,000 MMR | ~5,600 MMR | Archon 4 / Ancient 2 / Divine 4 |
| SA | ~2,900 MMR | ~3,600 MMR | ~5,200 MMR | Archon 2 / Archon 5 / Divine 2 |
| ME | ~2,800 MMR | ~3,500 MMR | ~5,100 MMR | Archon 1 / Archon 5 / Divine 1 |
Why Your Region Changes What “Top 10%” Means in MMR
Dota 2 uses a single global MMR number across all servers. A 4,000 MMR player on EU and a 4,000 MMR player on SA have the same raw number — but they are at completely different percentiles within their respective server populations. The reason is straightforward: the populations playing each server have different average skill levels, different pool sizes, and different competitive histories.
Three structural factors drive most of the regional variation:
1. Player Pool Size and Skill Concentration
SEA has the largest ranked player pool globally, accounting for roughly 35-40% of all public Dota 2 activity tracked through OpenDota. EU follows at 25-30%. NA sits at around 8-10% and SA at 5-8%. China and the Middle East operate on separate server clusters with distinct player bases. A larger pool generally means more representation at the lower and middle brackets, which raises the MMR floor you need to clear in order to stand out percentile-wise.
China is the outlier here. The CN server has a smaller tracked ranked population than SEA or EU, but the average skill level within that pool is significantly higher. Casual players in China tend to gravitate toward mobile titles rather than Dota 2, which means the Dota 2 ranked pool skews toward dedicated, experienced players. That is why CN thresholds are the highest of any region by a wide margin.
2. Account Density at Lower Brackets
Regions with historically higher rates of alternate accounts and deranked accounts tend to have a compressed lower bracket, which inflates the overall percentile required to reach the top tiers. SEA has historically had the highest density of this kind of account activity, which partly explains why the SEA threshold for top 10% sits lower than EU or CIS despite SEA’s large player pool. The distribution on SEA is wider and flatter; on CN it is narrower and shifted higher.
3. Esports Culture and Professional Pathway
Regions with active professional Dota 2 scenes — EU, CN, CIS — pull more high-MMR players into the ranked ecosystem. Former pros, semi-pros, and coaches all maintain active ranked accounts, which concentrates talent at the 6,000-8,000+ MMR band and creates a steeper curve at the top 1% tier. NA, SA, and ME have smaller pro scenes by comparison, which means the top 1% cutoff in those regions is lower in absolute terms.
For a detailed breakdown of how the medal percentages distribute across each region — from Herald through Immortal — see our Dota 2 rank distribution by region 2026 guide.
EU Server — MMR Percentile Breakdown
EU is the second most competitive major server globally by average MMR, behind only China. The EU ranked pool is large and contains a high proportion of experienced players, including many former Eastern European semi-pros who continued climbing after the CIS/EU server merge periods.
| Percentile | Approx. MMR (EU) | Medal Bracket | Context |
|---|---|---|---|
| Top 25% | ~2,800 MMR | Archon 1-2 | Better than 3 in 4 EU players |
| Top 10% | ~4,000 MMR | Ancient 2 | Ancient 2+ is genuinely elite on EU |
| Top 5% | ~4,800 MMR | Divine 2 | Low Divine is top 5% on EU |
| Top 1% | ~6,400 MMR | Immortal | Immortal leaderboard territory |
The gap between EU’s top 10% and top 1% cutoff is approximately 2,400 MMR — one of the largest gaps of any region. That reflects the density of very high-MMR players in the EU pool. Reaching 4,000 MMR on EU puts you solidly in the top 10%, but the jump from 4,000 to Immortal-level play on EU is steep. For comparison, the same 4,000 MMR on NA sits closer to the top 5%. This is an important consideration if you are choosing which server to calibrate or climb on.
China (CN) — MMR Percentile Breakdown
China operates on a separate server cluster and has historically produced the highest-MMR player base in the world. The competitive culture around Dota 2 in China is deeply rooted, and the active ranked population skews heavily toward experienced players. Top-10% MMR on CN is higher than top-5% on most other regions.
| Percentile | Approx. MMR (CN) | Medal Bracket | Context |
|---|---|---|---|
| Top 25% | ~3,400 MMR | Archon 4-5 | The CN median is higher than EU top 25% |
| Top 10% | ~4,500 MMR | Ancient 5 | Ancient 5 on CN = top 10%, not top 3% |
| Top 5% | ~5,400 MMR | Divine 4 | Divine 4 is where CN’s top 5% begins |
| Top 1% | ~7,100 MMR | High Immortal | CN top 1% overlaps with semi-pro range |
These numbers illustrate why CN is considered the hardest server to rank up on. A player with 4,500 MMR is in the top 10% globally — but on CN, that same MMR does not even crack the top 10%. If you are climbing on CN and struggling, that is not a reflection of your global standing. You are competing against one of the most skilled player pools on the planet.
CIS Server — MMR Percentile Breakdown
The CIS region — covering Russia, Ukraine, and neighboring countries — has historically been one of the most competitive regions in professional Dota 2. The CIS ranked pool is smaller than EU or SEA, but the average MMR is high. Several TI-winning rosters have been built predominantly from CIS players, and that esports culture filters down into the ranked ladder.
| Percentile | Approx. MMR (CIS) | Medal Bracket | Context |
|---|---|---|---|
| Top 25% | ~2,600 MMR | Crusader 5 — Archon 1 | CIS players are competitive even in lower brackets |
| Top 10% | ~3,800 MMR | Ancient 1 | Ancient 1 signals real mastery on CIS |
| Top 5% | ~4,600 MMR | Divine 2 | Closely mirrors EU top 5% |
| Top 1% | ~6,200 MMR | Immortal | Slightly below EU top 1% threshold |
CIS thresholds sit just below EU across every tier, reflecting a slightly smaller population at the very top. However, the gap is narrow — CIS and EU remain the two most similar major regions in terms of MMR distribution shape. Players who calibrated on CIS and moved to EU often find the transition smoother than expected, because the skill curve at each bracket is comparable.
SEA Server — MMR Percentile Breakdown
SEA is the largest player pool in Dota 2, covering the Philippines, Indonesia, Thailand, Vietnam, Singapore, Malaysia, and neighboring countries. The sheer size of the pool creates a wide skill spread. The median SEA player is at a lower MMR than the median EU player, but the very top of SEA — top 1%, high Immortal — is intensely competitive, with several SEA players consistently ranking on the global Immortal leaderboard.
| Percentile | Approx. MMR (SEA) | Medal Bracket | Context |
|---|---|---|---|
| Top 25% | ~2,200 MMR | Crusader 3-4 | Wide lower bracket due to pool size |
| Top 10% | ~3,500 MMR | Archon 5 | Late Archon qualifies as top 10% on SEA |
| Top 5% | ~4,200 MMR | Ancient 4 | Ancient 4 = top 5% on SEA |
| Top 1% | ~5,900 MMR | Divine 5 — Immortal | SEA top 1% overlaps with EU top 3% |
The SEA top 10% cutoff of approximately 3,500 MMR is about 500 MMR lower than EU’s. This is meaningful if you are trying to understand your standing across servers. An Archon 5 player on SEA is in the top 10% of their server — the same player on EU would be top 20-25%. The games at that MMR feel different for the same reason: the opposition pool changes.
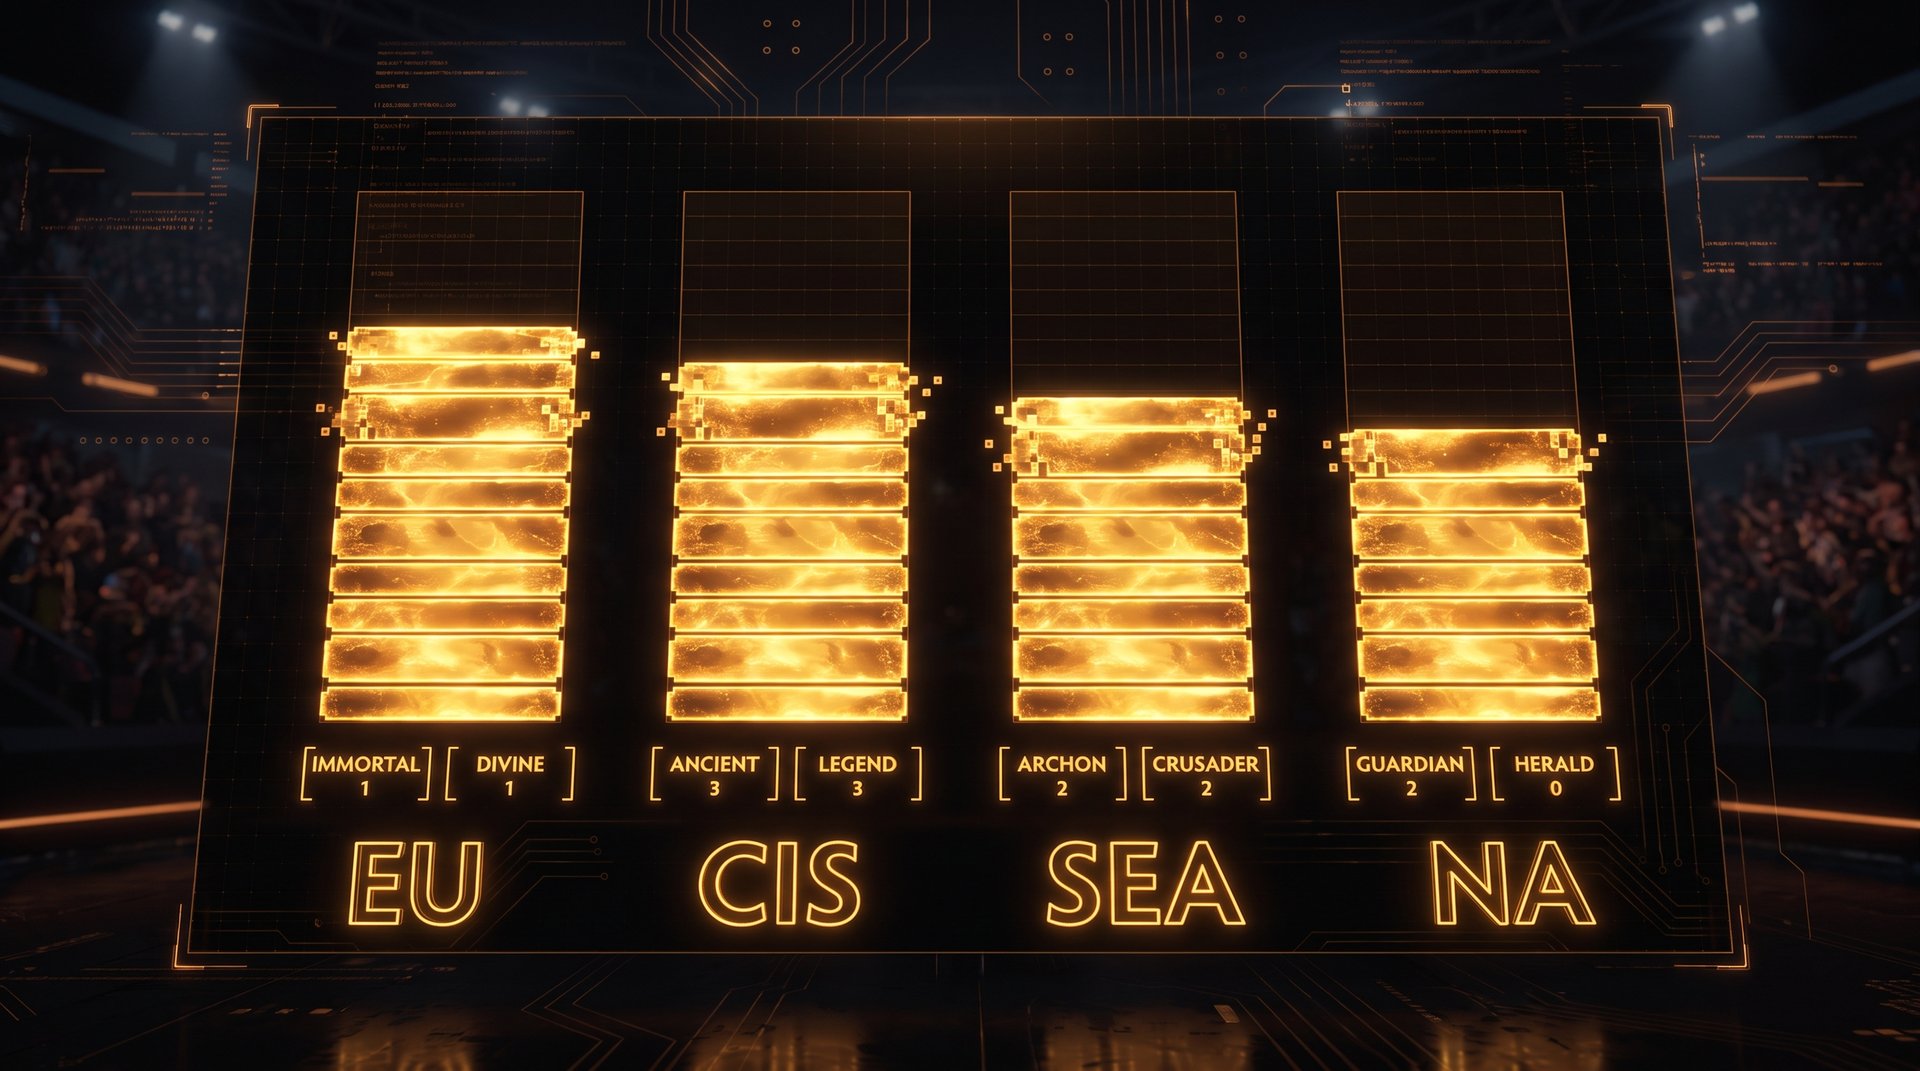
North America (NA) — MMR Percentile Breakdown
NA has the smallest ranked player pool of the major Western servers, accounting for roughly 8-10% of global tracked activity. That smaller population creates lower MMR thresholds across all percentile bands compared to EU and CIS. It also means matchmaking quality at higher MMR brackets on NA is more variable — queues are longer, and games at 4,500+ MMR can sometimes feel inconsistent because there are fewer players to fill the pool.
| Percentile | Approx. MMR (NA) | Medal Bracket | Context |
|---|---|---|---|
| Top 25% | ~2,100 MMR | Crusader 3 | Smaller pool means lower median |
| Top 10% | ~3,300 MMR | Archon 4 | Archon 4 is top 10% on NA — not on EU |
| Top 5% | ~4,000 MMR | Ancient 2 | Ancient 2 = top 5% on NA |
| Top 1% | ~5,600 MMR | Divine 4 | NA top 1% is roughly EU top 3% |
NA’s top 5% cutoff of around 4,000 MMR is the same as EU’s top 10% cutoff. This is one of the starkest regional differences in Dota 2. A player who is top 5% on NA and curious how they would perform on EU should expect to be playing against players of meaningfully higher calibre at equivalent matchmaking ratings. This is why some NA players who want to stress-test their mechanics switch to EU servers.
South America (SA) — MMR Percentile Breakdown
SA has a smaller but dedicated Dota 2 player base. The region has produced several standout professional players, but the overall pool depth is thinner than the major Western or Asian servers. SA thresholds are among the lowest of any region — which means reaching top-10% status on SA requires notably less MMR than on EU, CIS, or CN.
| Percentile | Approx. MMR (SA) | Medal Bracket | Context |
|---|---|---|---|
| Top 25% | ~1,900 MMR | Crusader 2 | Lower median than NA or EU |
| Top 10% | ~2,900 MMR | Archon 2 | Archon 2 is top 10% on SA |
| Top 5% | ~3,600 MMR | Archon 5 | Late Archon puts you in SA’s top 5% |
| Top 1% | ~5,200 MMR | Divine 2 | SA’s top 1% is around EU top 7% |
One important context for SA players: the lower threshold does not mean the ladder is easy. It means the distribution is compressed at the top. There are fewer players between 5,000 and 8,000 MMR on SA compared to EU or SEA, which can make high-MMR games inconsistent in quality. If you are an SA player considering whether to push toward the top 1%, be aware that the matchmaking experience at 5,000+ MMR on SA is different from what you would get on SEA or EU at the same number.
Middle East (ME) — MMR Percentile Breakdown
The Middle East is the newest of the major server regions and has the lowest MMR thresholds of any cluster. The ranked pool is growing — particularly in countries like Iran, Turkey (which straddles EU and ME), and Saudi Arabia — but it remains the smallest of the tracked regions. Top-10% status on ME requires the lowest MMR of any region included here.
| Percentile | Approx. MMR (ME) | Medal Bracket | Context |
|---|---|---|---|
| Top 25% | ~1,800 MMR | Crusader 1-2 | Youngest major server pool |
| Top 10% | ~2,800 MMR | Archon 1 | Archon 1 = top 10% on ME |
| Top 5% | ~3,500 MMR | Archon 5 | Archon 5 reaches the ME top 5% |
| Top 1% | ~5,100 MMR | Divine 1 | ME top 1% is growing rapidly year on year |
ME thresholds are expected to rise as the region matures. Players who have been on ME servers for several years have noted a consistent upward trend in average game quality — particularly at the Archon and Legend brackets. If you are on ME and are reading this in late 2026, it is worth checking updated data, since ME distribution shifts faster year-on-year than the more established regions.
How to Use These Numbers to Set Climbing Goals
The table above is a diagnostic tool, not a verdict. Here is how to extract actionable insight from it.
Step 1: Find Your Current Percentile
Take your current MMR and locate it in your region’s breakdown. If you are at 3,500 MMR on EU, you are in the top 15-20% of the EU server — genuinely good, but not yet in the top 10%. If you are at 3,500 MMR on SA, you are in the top 5%. Same MMR number, very different standing. Use the Dota 2 MMR calculator to get a more precise live figure.
Step 2: Set a Concrete MMR Target Instead of a Medal Target
Most players set goals like “I want to reach Ancient.” The problem is that Ancient spans a wide MMR range and the percentile within Ancient varies by server. A better goal: “I want to be in the top 10% of my server.” That translates directly to a specific MMR number — which you can track, measure, and chase systematically.
To understand where the global median sits and how “good MMR” compares across all brackets, see our deep-dive on what MMR is considered good in 2026.
Step 3: Understand the Rate-of-Return on Your Climb
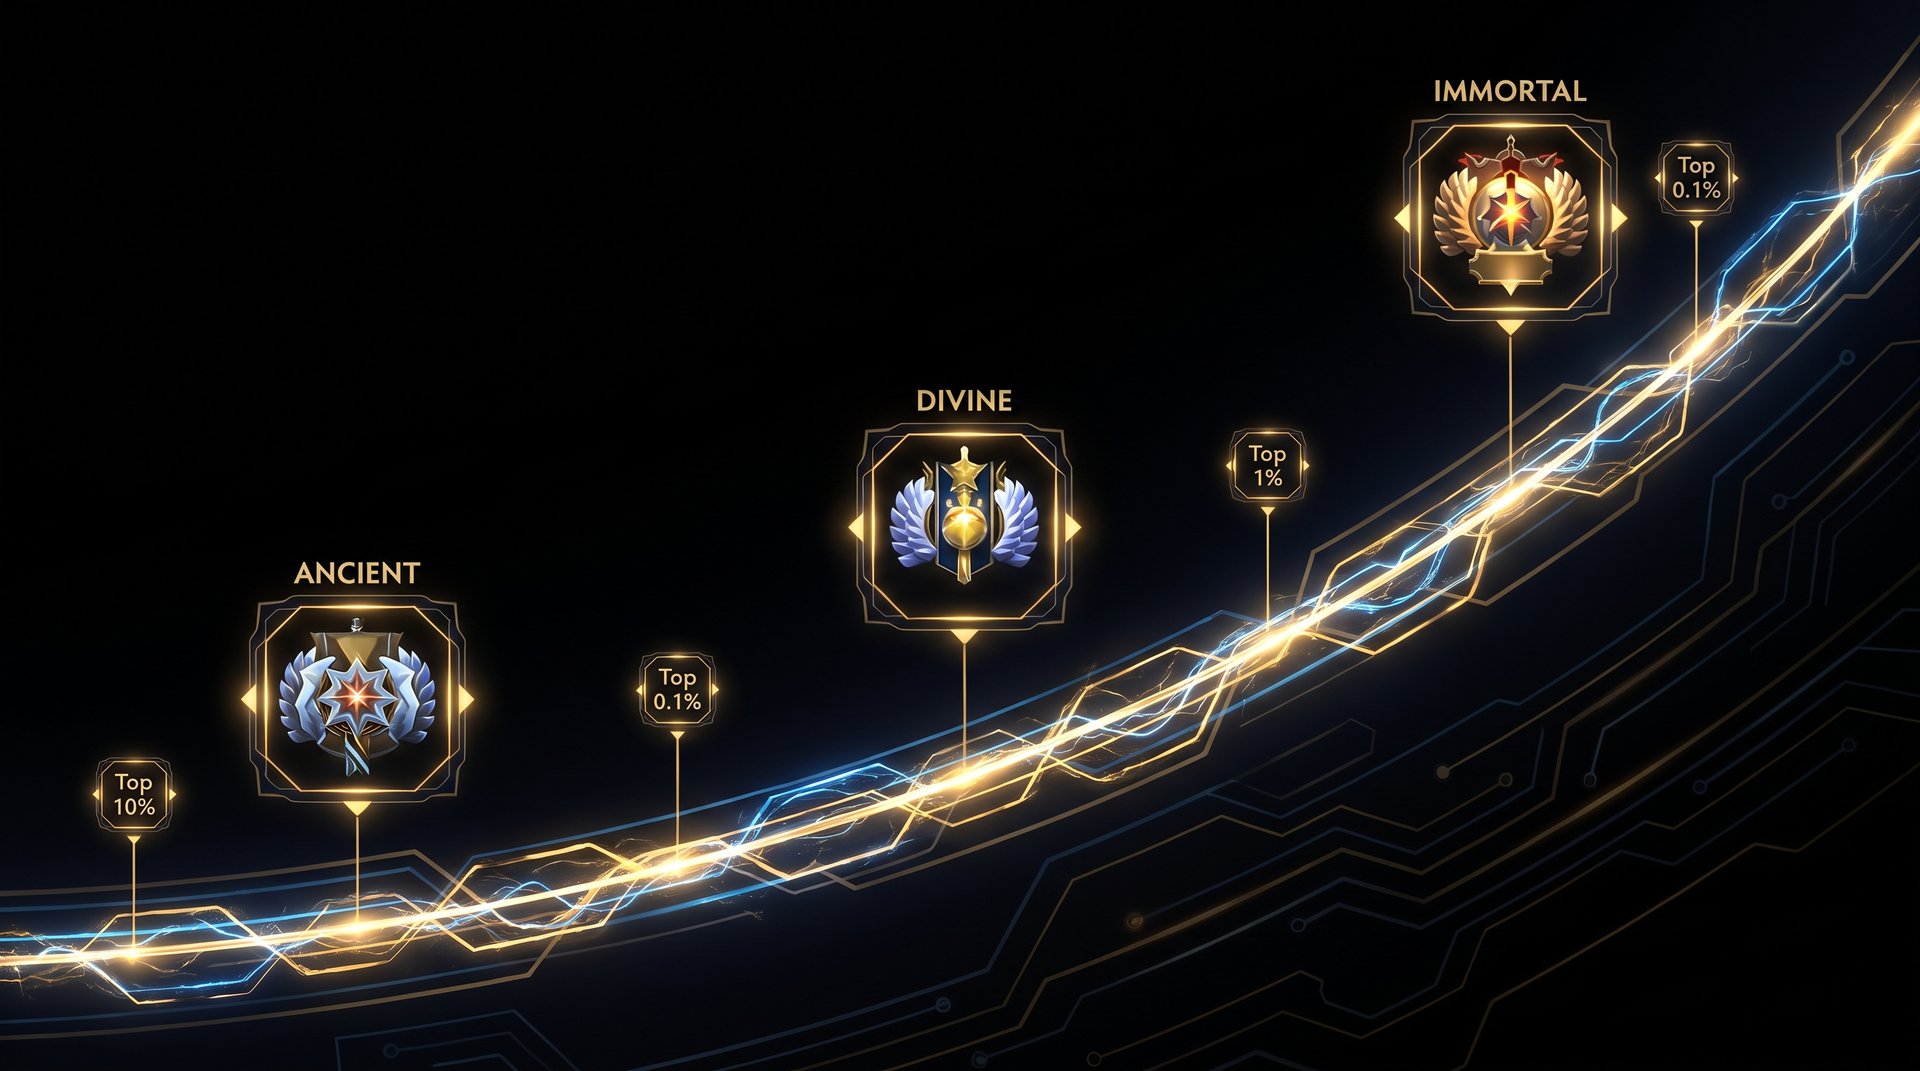
Not every bracket is equal in terms of what you need to change to advance. Moving from top 25% to top 10% on most servers is a smaller absolute MMR jump than moving from top 10% to top 5%. The curve steepens. Once you are above the top 10% threshold, each additional percentile point requires more effort — and more targeted skill development — than the ones before it. This is where focused coaching tends to show the biggest return, because the mistakes keeping you just outside the top 5% are usually more subtle than the ones that kept you out of the top 25%.
Step 4: Account for Seasonal Drift
After each major patch, rank distributions shift. The Glicko recalibration system means that a big patch can compress or expand the brackets unpredictably. The thresholds in this article are mid-2026 figures. If you are reading this after a major reset or a patch in the 7.42+ range, treat these as directional estimates and verify against current community data on Stratz or OpenDota. See the full Dota 2 rank distribution breakdown for the most current global figures.
For players who want to accelerate the climb to their target percentile, a professional MMR boost can compress weeks of grinding into a more efficient process — particularly if the goal is reaching a specific calibration for a new season. See our MMR boosting guide for how that process works and what to expect. The key is choosing a service that handles your specific server — not every boosting team operates across all regions.
Ready to Hit Your Region’s Top 10%?
TeamSmurf operates across every major server — EU, SEA, NA, SA, CIS, CN, and ME. Our boosters play on your region with accounts that match your server’s MMR distribution, so the result you get is real and calibrated correctly.
Is Reaching the Top 10% Worth the Effort?
This is a question worth answering honestly. Top 10% means something real in Dota 2 — it is the threshold where you start to genuinely understand the game at a higher level. Games below top 10% are heavily influenced by individual mechanical errors. Games above it start to be decided more by team coordination, draft reads, and macro decision-making. Making that transition changes the game you are playing.
But the answer depends on your region. On NA, reaching top 10% at around 3,300 MMR is achievable for most serious players within a season of focused grinding. On EU or CN, reaching top 10% at 4,000-4,500 MMR requires a level of consistent mechanical and game-sense development that takes most players multiple seasons. Neither is better or worse — they are different competitive ecosystems.
The most useful framing is not “am I top 10% globally” but “what does top 10% on my server actually require from me, and do I have those skills yet?” The percentile table gives you the MMR target. Knowing the skills behind that number is the other half of the picture — and that is where one-on-one Dota 2 coaching from a player already operating at that level can cut the timeline significantly.
For a broader look at what “good” means in concrete percentile terms across all brackets globally, read our companion guide: What MMR is considered good in 2026 — honest percentiles. That guide covers the global distribution in depth; this one gives you the regional breakdown you need to contextualise it.
Players looking to verify whether their climb is realistic given where they are now can also benchmark against the best Dota 2 boosting services data, which includes real climb rates across regions and bracket tiers.
Is MMR Boosting Safe for Reaching These Percentile Targets?
This is a common question. The short answer: it depends on the service. A reputable boosting service operates using your credentials only as much as needed, uses VPN coverage matched to your location, and completes the climb without leaving behavioral flags that trigger Valve’s detection systems. We cover the full picture in our guide on whether Dota 2 boosting is safe.
One important note: boosting is a means to get to a target MMR, not a substitute for understanding why you are at a certain percentile. Players who boost to their target and then play without addressing the skills gap often fall back. The most effective use of a boost is to get you to a tier where you can access higher-quality teammates and opponents to learn from — combined with coaching to anchor the skills that keep you there. TeamSmurf offers both as a combined package for exactly this reason.
Frequently Asked Questions
Reach Your Target Percentile on Any Server
TeamSmurf boosts and coaches across EU, SEA, NA, SA, CIS, CN, and ME. Tell us your current MMR, your target percentile, and your region — we will give you a clear path to getting there.


