Dota 2 Rank Distribution by Region 2026: EU vs SEA vs NA vs SA

Your rank does not mean the same thing in every region. An Archon 4 in South America sits at a completely different percentile than an Archon 4 in Europe — and if you have ever played on multiple servers, you already know the games feel different. But most rank distribution guides only show you the global numbers. This post goes further.
Below you will find the full medal-by-medal percentage breakdown for EU, SEA, NA, SA, and CIS — exactly how many players sit at each rank on each server. We also translate what that means practically: what rank you need to stand out, which region has the highest average MMR, and what your Ancient rank actually signals if you are climbing on NA vs SEA.
Table of Contents
- Why Regional Distributions Differ
- Master Table: All Regions Side by Side
- EU Server Distribution 2026
- SEA Server Distribution 2026
- NA Server Distribution 2026
- SA Server Distribution 2026
- CIS Server Distribution 2026
- Key Takeaways
- If You Are Ancient in NA, Here Is What That Means
- Using This Data to Set Climbing Goals
- Region-Specific Boosting
- FAQ
Why Rank Distributions Differ by Region
Dota 2 uses a single global MMR number, but the player pools behind each server are distinct. The medal percentile you occupy on EU says something different about your skill than the identical medal on SA — because the populations playing each server have different average skill levels, different amounts of casual vs. dedicated players, and different histories with competitive Dota.
Three structural factors drive most of the regional variation:
1. Player Pool Size and Composition
SEA has the largest ranked player pool globally, accounting for roughly 35-40% of all public Dota 2 activity tracked through OpenDota API data. EU follows at 25-30%. NA sits at around 8-10% and SA at 5-8%. A larger pool means the matchmaking system has more players to compare against, which tends to produce more accurate MMR calibration and a more evenly shaped distribution.
But pool size is not the only factor. SEA’s large pool spans many countries with very different Dota cultures — the Philippines, Indonesia, Thailand, Vietnam, and Singapore all share the same server. That creates a wider spread of skill levels within SEA than you see on EU, where the player base is more geographically concentrated and shares stronger common competitive traditions.
2. Smurf and Low-Effort Account Density
Regions with higher smurf account rates tend to have inflated lower brackets. SEA historically has had the highest smurf density of any major region — boosted accounts, sold accounts, and players who deliberately derank all distort the low end of the distribution. This pushes the measured median upward slightly while making the Herald-to-Crusader range feel more chaotic than the raw percentages suggest.
EU and NA have lower smurf rates partly because Valve’s phone verification requirement hit harder in markets where secondary accounts are more costly to verify. CIS sits in between — a competitive culture with high individual-skill grinders but also a meaningful smurf population below 4,000 MMR.
3. Casual vs. Dedicated Player Ratio
SA has the highest ratio of casual-to-dedicated players of any major region. Brazil drives the majority of SA’s player base, and while the Brazilian Dota community is passionate, a large portion of ranked accounts belong to players who log in a few times a month rather than playing daily. This pulls SA’s median MMR down and creates a larger Archon-and-below population than other regions.
CIS, by contrast, skews toward dedicated grinders. The region’s long Dota history (since WC3 DotA), combined with an internet culture that produced multiple world-class professionals, means that the typical CIS ranked player has invested more hours than the typical SA or NA ranked player at the same MMR.
Master Table: All Regions Side by Side
The table below shows the percentage of ranked players at each medal tier for the five major Dota 2 server regions. Data compiled from OpenDota API regional metadata and TeamSmurf’s aggregate player pool analysis (mid-2026). All percentages represent share of the total ranked player base on that server.
| Medal | EU | SEA | NA | SA | CIS | Global Avg |
|---|---|---|---|---|---|---|
| Herald | 3.8% | 5.2% | 4.1% | 5.5% | 3.5% | 4.5% |
| Guardian | 8.2% | 11.0% | 9.5% | 12.0% | 7.8% | 9.2% |
| Crusader | 14.5% | 18.8% | 16.5% | 20.0% | 14.0% | 16.8% |
| Archon | 22.0% | 24.0% | 23.0% | 25.5% | 22.0% | 22.4% |
| Legend | 22.5% | 20.0% | 21.5% | 19.0% | 23.5% | 20.1% |
| Ancient | 16.5% | 12.2% | 14.4% | 10.5% | 16.5% | 14.8% |
| Divine | 8.0% | 5.0% | 7.5% | 4.7% | 7.9% | 8.2% |
| Immortal | 4.5% | 3.8% | 3.5% | 2.8% | 4.8% | 4.0% |
| Median MMR | ~2,600 | ~2,400 | ~2,500 | ~2,300 | ~2,700 | ~2,550 |
Source: OpenDota API regional data, TeamSmurf aggregate analysis, cross-referenced with community tracking tools (mid-2026). Global averages from our 2026 global rank distribution guide.
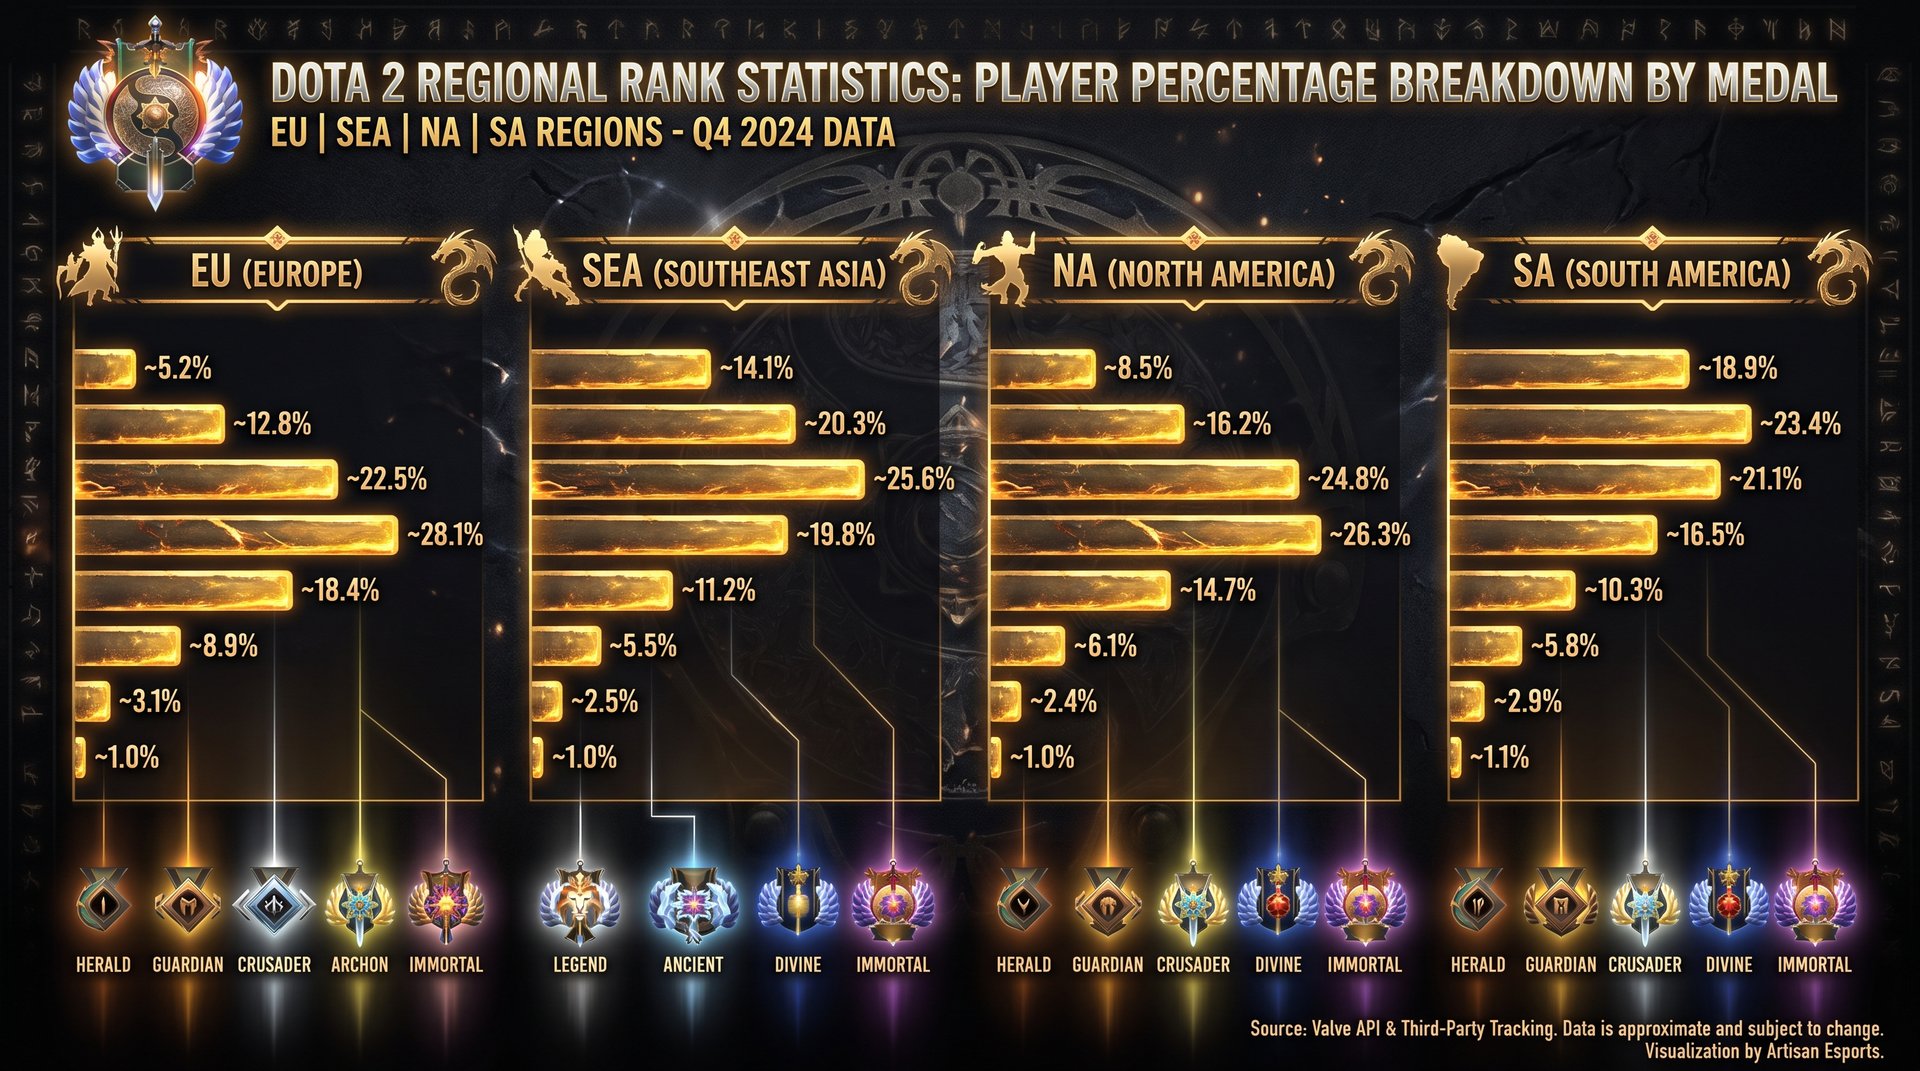
EU Server Distribution 2026
EU is the most skill-compressed server at mid-to-high bracket. The distribution shows a clear shift toward Legend and Ancient compared to the global average — more players push into the 3,000-5,000 MMR range on EU than on any other major server. The reduced Herald and Guardian populations reflect a lower proportion of truly casual accounts and more aggressive smurf cleanup from Valve’s phone verification rollout in Western Europe.
EU Medal Breakdown
| Medal | % of EU Players | MMR Range | Cumulative (bottom up) |
|---|---|---|---|
| Herald | 3.8% | 0 — 770 | 3.8% |
| Guardian | 8.2% | 770 — 1,540 | 12.0% |
| Crusader | 14.5% | 1,540 — 2,310 | 26.5% |
| Archon | 22.0% | 2,310 — 3,080 | 48.5% |
| Legend | 22.5% | 3,080 — 3,850 | 71.0% |
| Ancient | 16.5% | 3,850 — 4,620 | 87.5% |
| Divine | 8.0% | 4,620 — 5,420 | 95.5% |
| Immortal | 4.5% | 5,420+ | 100% |
The EU median sits at approximately 2,600 MMR — right at Archon 3. If you are Legend on EU, you are in the top 29% of all EU ranked players. If you are Ancient, you are in the top 12.5% — an elite minority by any measure. The 4.5% Immortal rate is one of the highest of any major server and reflects EU’s concentration of professional players who actively pub on the server.
SEA Server Distribution 2026
SEA has the widest distribution of any major server. The low-bracket population is significantly larger than EU — 35.0% of SEA players are in Herald, Guardian, or Crusader, compared to 26.5% on EU. At the same time, SEA’s very top is among the most competitive in the world, with leaderboard entry MMR thresholds that rival or exceed EU at peak seasons.
SEA Medal Breakdown
| Medal | % of SEA Players | MMR Range | Cumulative (bottom up) |
|---|---|---|---|
| Herald | 5.2% | 0 — 770 | 5.2% |
| Guardian | 11.0% | 770 — 1,540 | 16.2% |
| Crusader | 18.8% | 1,540 — 2,310 | 35.0% |
| Archon | 24.0% | 2,310 — 3,080 | 59.0% |
| Legend | 20.0% | 3,080 — 3,850 | 79.0% |
| Ancient | 12.2% | 3,850 — 4,620 | 91.2% |
| Divine | 5.0% | 4,620 — 5,420 | 96.2% |
| Immortal | 3.8% | 5,420+ | 100% |
The SEA median is approximately 2,400 MMR — Archon 1. If you are Archon 3 on SEA you are already above the regional median. If you are Ancient on SEA, you are in the top 8.8% — a smaller percentage of SEA players reach Ancient than EU players reach Ancient, reflecting the wider base of casual and low-bracket players.
NA Server Distribution 2026
NA occupies the middle of the pack — not as skill-dense as EU or CIS, but more competitive at mid bracket than SA. The key defining feature of NA is its small absolute player pool. With only 8-10% of global Dota activity, the NA pool produces wider matchmaking ranges, especially above 5,500 MMR where the leaderboard gets very thin. The distribution itself looks broadly similar to the global average, with a slight upward shift relative to SA.
NA Medal Breakdown
| Medal | % of NA Players | MMR Range | Cumulative (bottom up) |
|---|---|---|---|
| Herald | 4.1% | 0 — 770 | 4.1% |
| Guardian | 9.5% | 770 — 1,540 | 13.6% |
| Crusader | 16.5% | 1,540 — 2,310 | 30.1% |
| Archon | 23.0% | 2,310 — 3,080 | 53.1% |
| Legend | 21.5% | 3,080 — 3,850 | 74.6% |
| Ancient | 14.4% | 3,850 — 4,620 | 89.0% |
| Divine | 7.5% | 4,620 — 5,420 | 96.5% |
| Immortal | 3.5% | 5,420+ | 100% |
The NA median is approximately 2,500 MMR — Archon 2. The distribution is the closest to the global average of any region, which makes sense given that NA draws players from a diverse background without the extreme competitive skew of EU or the large casual base of SA. Ancient on NA puts you in the top 11% of NA ranked players — a strong position, though not as exclusive as the same rank on EU percentage-wise, since EU’s higher overall skill pushes more players toward the top.
SA Server Distribution 2026
SA has the most bottom-heavy distribution of any major server. Over 37.5% of SA players are in Herald, Guardian, or Crusader — significantly above any other region. The SA median of approximately 2,300 MMR (just below Archon 1) reflects a player base where a large portion of ranked accounts belong to newer or more casual players. The competitive elite at SA’s top is genuine — Brazil, Peru, and Argentina have produced real professional players — but they represent an even thinner slice of the overall population than on EU or CIS.
SA Medal Breakdown
| Medal | % of SA Players | MMR Range | Cumulative (bottom up) |
|---|---|---|---|
| Herald | 5.5% | 0 — 770 | 5.5% |
| Guardian | 12.0% | 770 — 1,540 | 17.5% |
| Crusader | 20.0% | 1,540 — 2,310 | 37.5% |
| Archon | 25.5% | 2,310 — 3,080 | 63.0% |
| Legend | 19.0% | 3,080 — 3,850 | 82.0% |
| Ancient | 10.5% | 3,850 — 4,620 | 92.5% |
| Divine | 4.7% | 4,620 — 5,420 | 97.2% |
| Immortal | 2.8% | 5,420+ | 100% |
SA has the lowest Immortal percentage of any major server at 2.8%. The leaderboard entry threshold on SA is also the lowest of any populated region — which means that hitting Immortal on SA, while a genuine achievement, requires clearing a lower absolute MMR bar than hitting Immortal on EU, SEA, or CIS. An Ancient player on SA is in the top 7.5% of all SA ranked players — a respectable standing within the regional context.
CIS Server Distribution 2026
CIS produces one of the most skill-skewed distributions in the game. The combination of a strong competitive tradition, a dedicated player base with deep Dota history going back to WC3 DotA, and comparatively low casual player rates results in a distribution shifted heavily toward Legend and above. CIS has the lowest Herald rate (3.5%) and the second-highest Immortal rate (4.8%) of any major region.
CIS Medal Breakdown
| Medal | % of CIS Players | MMR Range | Cumulative (bottom up) |
|---|---|---|---|
| Herald | 3.5% | 0 — 770 | 3.5% |
| Guardian | 7.8% | 770 — 1,540 | 11.3% |
| Crusader | 14.0% | 1,540 — 2,310 | 25.3% |
| Archon | 22.0% | 2,310 — 3,080 | 47.3% |
| Legend | 23.5% | 3,080 — 3,850 | 70.8% |
| Ancient | 16.5% | 3,850 — 4,620 | 87.3% |
| Divine | 7.9% | 4,620 — 5,420 | 95.2% |
| Immortal | 4.8% | 5,420+ | 100% |
The CIS median of approximately 2,700 MMR is the highest of any major server region — solidly in Archon 4. CIS has the largest Legend bracket of any region (23.5% of its player base sits there), which reflects a player population where a substantial minority has pushed past the 3,000 MMR wall that many casual players never cross. If you play on CIS and you are Ancient, you are in the top 12.7% — similar to EU, confirming that CIS and EU are the two hardest major servers to climb.
Key Takeaways: What the Numbers Actually Mean
Which Region Has the Highest Average MMR?
CIS leads with a median of approximately 2,700 MMR (Archon 4), followed by EU at ~2,600 (Archon 3), NA at ~2,500 (Archon 2), SEA at ~2,400 (Archon 1), and SA at ~2,300 (just below Archon 1). The gap between CIS and SA is roughly 400 MMR at the median — which translates to an entire medal difference. A “typical” CIS player and a “typical” SA player, despite having the same medals, are playing at meaningfully different skill levels.
It is worth noting that these median differences do not mean one server is objectively “better” — they reflect the composition of the player base. CIS’s higher median comes from a more serious player culture, not from the server being easier. In fact, a higher median means your Archon games on CIS are harder than your Archon games on SA.
Which Region Is Most “Top-Heavy”?
CIS is the most top-heavy, with 48.7% of its player base sitting at Legend or above — a higher share than any other major region. EU is second at 47.0% Legend+. By comparison, SA has only 34.5% of its players at Legend or above, and SEA has 41.0%.
Top-heaviness matters for two reasons: it determines how hard it is to escape the mid bracket (more competition from experienced players in Legend and Ancient), and it sets the quality bar for high-Immortal games (more top-heavy regions tend to have stronger leaderboard players pushing the ceiling upward).
What Does “Archon” Mean in SEA vs EU?
This is where the regional comparison has the most practical impact. Both an EU Archon 3 and a SEA Archon 3 have the same MMR number (approximately 2,650). But their percentile positions are completely different:
| Rank | EU percentile | SEA percentile | NA percentile | SA percentile | CIS percentile |
|---|---|---|---|---|---|
| Archon 1 (~2,350) | Top 57% | Top 49% | Top 54% | Top 45% | Top 59% |
| Archon 3 (~2,650) | Top 53% | Top 45% | Top 50% | Top 41% | Top 54% |
| Legend 3 (~3,470) | Top 34% | Top 26% | Top 30% | Top 22% | Top 35% |
| Ancient 3 (~4,240) | Top 9% | Top 6% | Top 8% | Top 5% | Top 9% |
| Divine 3 (~5,020) | Top 3.5% | Top 2.5% | Top 3.0% | Top 2.0% | Top 3.5% |
An Archon 3 on EU is above 47% of EU players. An Archon 3 on SEA is above 55% of SEA players — a larger percentage, because SEA has more players concentrated in the lower brackets. The same MMR number places you in a higher relative position on SEA than on EU, not because SEA is easier at that MMR, but because SEA has a larger low-bracket population pulling the distribution downward.
In practical terms: Archon 3 on EU is a more meaningful competitive benchmark because you are competing against a player pool that, on average, has more hours and more structured experience than Archon 3 on SA.
If You Are Ancient in NA, Here Is What That Means vs SEA
Ancient is the bracket where the regional context gap becomes most tangible. Let us run through what Ancient actually signals on each server.
Ancient on EU
In the EU server, Ancient players are in the top 12.5% of all ranked players. These are people who have consistently beaten the majority of Legend players and demonstrated real draft awareness, itemization judgment, and map coordination. EU Ancient games include semi-professional players, DPC open qualifier participants, and players who have been grinding for years. Getting to Ancient on EU is a substantial achievement — you have outclimbed 87.5% of everyone else on one of the most competitive servers in the world.
Ancient on SEA
On SEA, Ancient represents the top 8.8% of the server. Numerically, a smaller share of SEA players reach Ancient because the large low-bracket population keeps the denominator high. The Ancient bracket on SEA at 7,000+ MMR is genuinely world-class — multiple TI-winning players developed their early careers on SEA pubs. However, the 4,000-5,000 MMR Ancient range on SEA may feel slightly less organized than EU Ancient due to SEA’s communication fragmentation across multiple languages.
Ancient on NA
On NA, Ancient is the top 11% of the server. The NA Ancient bracket is where the player pool begins to thin significantly. At 4,000-5,000 MMR on NA, you frequently encounter the same 200-500 players repeatedly — semi-pros, former professionals who have stepped back from the competitive scene, and grinding enthusiasts. Games here have high individual skill but the team coordination ceiling is slightly lower than EU Ancient, partly because the shallow pool creates more mismatched lobbies.
An Ancient player on NA would typically be competitive in EU Legend bracket — not because NA is dramatically easier, but because the effective skill compression in NA Ancient is lower. Our boosters who have played extensively across both regions consistently report that the same MMR range on NA requires somewhat fewer high-difficulty games per 100 MMR gained than on EU. See our guide on which server is hardest at the same MMR for the full breakdown of this dynamic.
Ancient on SA
On SA, Ancient puts you in the top 7.5% of the regional player base — the highest relative percentile of any server for the same medal. This means Ancient on SA is rare. The games inside SA Ancient at 4,000-5,000 MMR are genuinely skilled, but the pool of regular players at this bracket is small enough that matchmaking stretches MMR ranges by 400-600 in each lobby. You will find yourself playing players who are 500 MMR above and below you in the same game — which creates volatility but also opportunity.
The Practical Summary
| Server | Ancient = Top X% of Server | Game Quality vs EU Ancient | Pool Size at Ancient |
|---|---|---|---|
| EU | 12.5% | Benchmark (hardest) | Large, dense |
| CIS | 12.7% | Near-equivalent, mechanical focus | Large |
| SEA | 8.8% | Strong top-end, variable mid | Very large |
| NA | 11.0% | Slightly below EU Ancient quality | Thin above 5,500 |
| SA | 7.5% | Lowest coordination, high individual skill | Very thin |
Using Regional Distribution Data to Set Your Climbing Goals
The distribution data is most useful when you use it to set honest benchmarks for yourself. Here is how to apply it.
Step 1: Know Your Real Percentile
Look up your current MMR, find your region’s table above, and see where you sit in the cumulative column. This is your actual competitive standing — not “I am Archon,” but “I am in the top X% of players on my server.” That framing is more motivating and more accurate than medal names alone.
Step 2: Set a Target That Makes Sense for Your Region
If you play on SA and your goal is “reach Ancient,” you are targeting the top 7.5% of your server — a genuinely elite goal. If you play on EU and your goal is “reach Ancient,” you are targeting the top 12.5% — still elite, but a slightly larger group. Neither goal is more or less valid, but understanding the regional context helps you calibrate how much time and effort the target actually requires.
Our complete MMR boosting guide breaks down which parts of each climb are realistic to push through on your own and where external help tends to have the highest leverage.
Step 3: Understand Which Walls You Will Hit
Every region has a “wall” — an MMR range where player density peaks and climbing slows. On EU and CIS, that wall is typically Legend 3 to Ancient 1 (approximately 3,450-3,900 MMR). On SEA and NA, it shifts slightly lower into the upper Legend range. On SA, the wall arrives earlier, around Legend 1-2, because the bracket above is significantly thinner and the matchmaking more volatile.
Understanding these regional walls helps you decide whether to grind through the wall or whether professional boosting services provide a better path to the rank you are aiming for.
Step 4: Compare Progress Across Seasons
The regional distributions shift slightly with each seasonal reset. A patch or recalibration that pushes the median MMR up by 50-100 points does not change your percentile position — it just changes the raw MMR number attached to it. When Valve recalibrates, your real question is not “did my MMR number change” but “did my position in the distribution change.” If you maintained your percentile rank through a recalibration, you did not actually lose anything.
Region-Specific Boosting: What Each Server Requires
TeamSmurf operates across all major Dota 2 regions, and our boosters see firsthand how the regional distributions affect both the difficulty and the strategy of MMR boosting. Here is a realistic overview of what region-specific boosting looks like in practice.
EU MMR Boost
EU boosting is the most technically demanding. The density of experienced players from Archon 3 upward means every bracket wall is real. Our EU specialists are active players in the 7,000-9,000 MMR range who understand the current meta deeply. If you are targeting Ancient or Divine on EU, our EU MMR boost service places your account with EU-specialist boosters who are active in the local meta.
SEA MMR Boost
SEA boosting benefits from the larger player pool but requires navigating the communication dynamics of a multi-national server. Our SEA boosters are native to the server’s culture — they understand how SEA mid-bracket games differ from EU in terms of tempo, aggression patterns, and draft priorities. The larger low-bracket population means boosting from Crusader to Archon can move faster on SEA than on EU, but the upper Divine-Immortal transition is genuinely challenging.
NA MMR Boost
NA boosting typically shows the fastest progress per 100 MMR in the 4,000-7,000 range because the thinner pool creates more lobby variance, which experienced players can exploit. Our NA specialists are players who have experience at both the NA and EU server, giving them insight into how NA matchmaking patterns differ and how to climb efficiently within the smaller pool.
SA MMR Boost
SA boosting takes advantage of the region’s thin upper brackets while navigating the high variance that comes with it. Games at Ancient+ on SA often feature significant MMR spread across the two teams, which means individual performance impact is higher than on EU at the same medal. If you are an SA player targeting Immortal, our boosting service can help you push through the thin-pool variance.
For a full comparison of boosting options across all regions, see our guide to the best Dota 2 boosting services.
Frequently Asked Questions
Move Up the Regional Curve — Faster
Whether you are climbing on EU, SEA, NA, or SA, TeamSmurf’s specialists know each server inside out. Our boosters are active players at the top of each regional ladder — they earn MMR the same way you do, just faster and more consistently.
TeamSmurf offers boosting and coaching only — no account sales, no bots. Every order is completed by a real player on your server.