Dota 2 Rank Distribution 2026: Complete Data Analysis

Where do you really rank among Dota 2 players? Not where you think, not where you feel — but where the actual data puts you?
Most Dota 2 players dramatically overestimate their position. A Crusader player might feel “average,” not realizing they’re already in the top 60%. A Legend player might feel “stuck in the middle” while actually sitting in the top 25% of all ranked players worldwide.
This guide presents the most comprehensive Dota 2 rank distribution data for 2026 — complete with percentile breakdowns, regional comparisons, historical trends, and a frank discussion about what “average” really means. Whether you’re trying to contextualize your own rank or argue with your friends about who’s actually good, this data will settle it.
And if you’re not happy with where you land in the distribution? TeamSmurf’s MMR boosting can move you up the curve — fast.
Table of Contents
- 2026 Rank Distribution Overview
- Detailed Breakdown by Medal and Stars
- Percentile Analysis: Where You Stand
- Regional Differences
- Historical Shifts (2017-2026)
- What “Average” Really Means
- The Rank Inflation/Deflation Debate
- Player Population Trends
- What the Data Tells Us About Climbing
- FAQ
2026 Rank Distribution Overview
The following data is aggregated from multiple tracking sources including community databases, API data analysis, and verified player surveys. While Valve doesn’t publish official distribution numbers, these figures are consistent across independent sources and represent the best available estimates.
Medal Distribution Summary
| Medal | MMR Range | % of Players | Cumulative % | Percentile (Top) |
|---|---|---|---|---|
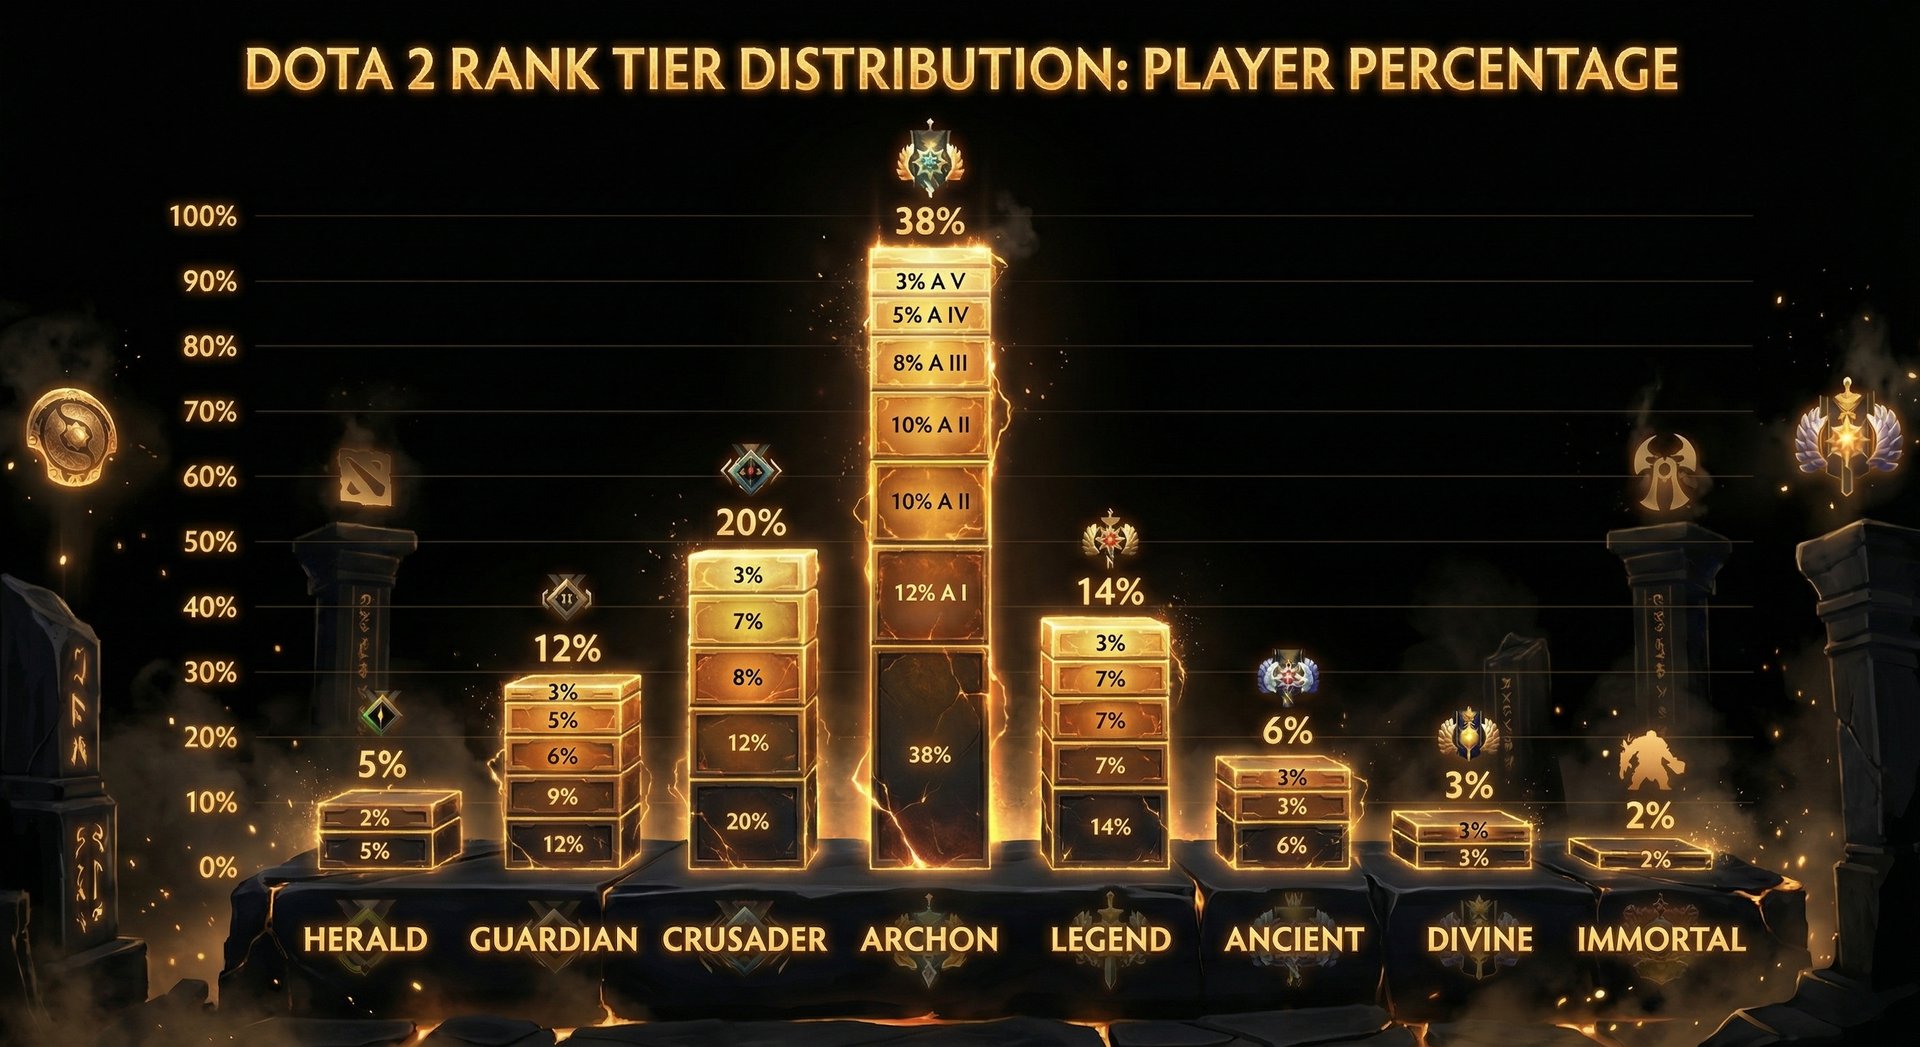
| Herald | 0 — 770 | 4.5% | 4.5% | Top 95.5% |
| Guardian | 770 — 1,540 | 9.2% | 13.7% | Top 86.3% |
| Crusader | 1,540 — 2,310 | 16.8% | 30.5% | Top 69.5% |
| Archon | 2,310 — 3,080 | 22.4% | 52.9% | Top 47.1% |
| Legend | 3,080 — 3,850 | 20.1% | 73.0% | Top 27.0% |
| Ancient | 3,850 — 4,620 | 14.8% | 87.8% | Top 12.2% |
| Divine | 4,620 — 5,420 | 8.2% | 96.0% | Top 4.0% |
| Immortal | 5,420+ | 4.0% | 100% | Top 4.0% |
Key takeaway: If you’re Archon, you’re literally the median. Half of all ranked players are below you. If you’re Legend, you’re already better than roughly 73% of all ranked Dota 2 players. And if you’ve hit Ancient, you’re in the top 12% — the equivalent of being in the top tier of most competitive activities.
The Bell Curve Shape
Dota 2’s rank distribution follows an approximately normal (Gaussian) distribution — a bell curve — with the peak sitting right around Archon 3-4 (approximately 2,500-2,700 MMR). This is by design: Valve calibrates medal boundaries so that the distribution stays roughly bell-shaped each season.
However, the curve isn’t perfectly symmetrical. It’s slightly right-skewed, meaning there’s a longer tail on the high end. This makes sense — there’s a hard floor at 0 MMR but no hard ceiling, allowing top players to push well above 12,000 MMR.
Detailed Breakdown by Medal and Stars
For players who want granular data, here’s the breakdown by individual star levels. Each medal has 5 stars, with star 1 being the lowest and star 5 being the highest within that medal.
Herald (0 — 770 MMR)
| Sub-tier | MMR Range | % of Players | Cumulative |
|---|---|---|---|
| Herald 1 | 0 — 154 | 0.8% | 0.8% |
| Herald 2 | 154 — 308 | 0.8% | 1.6% |
| Herald 3 | 308 — 462 | 0.9% | 2.5% |
| Herald 4 | 462 — 616 | 1.0% | 3.5% |
| Herald 5 | 616 — 770 | 1.0% | 4.5% |
Herald represents the absolute bottom of the ranked ladder. Many Herald players are genuinely new to MOBAs or play very casually. Some are also accounts that were abandoned or intentionally deranked. The actual number of “real” players actively trying to climb in Herald is likely smaller than the 4.5% suggests.
Guardian (770 — 1,540 MMR)
| Sub-tier | MMR Range | % of Players | Cumulative |
|---|---|---|---|
| Guardian 1 | 770 — 924 | 1.6% | 6.1% |
| Guardian 2 | 924 — 1,078 | 1.7% | 7.8% |
| Guardian 3 | 1,078 — 1,232 | 1.9% | 9.7% |
| Guardian 4 | 1,232 — 1,386 | 2.0% | 11.7% |
| Guardian 5 | 1,386 — 1,540 | 2.0% | 13.7% |
Guardian players have basic game understanding but struggle with efficiency — last-hitting, itemization timing, map awareness, and team fight positioning are all areas with massive room for improvement. A few focused coaching sessions can produce dramatic improvement at this bracket. Professional coaching at this level often results in 500-1,000 MMR gains within weeks.
Crusader (1,540 — 2,310 MMR)
| Sub-tier | MMR Range | % of Players | Cumulative |
|---|---|---|---|
| Crusader 1 | 1,540 — 1,694 | 2.9% | 16.6% |
| Crusader 2 | 1,694 — 1,848 | 3.1% | 19.7% |
| Crusader 3 | 1,848 — 2,002 | 3.4% | 23.1% |
| Crusader 4 | 2,002 — 2,156 | 3.6% | 26.7% |
| Crusader 5 | 2,156 — 2,310 | 3.8% | 30.5% |
Crusader is the “learning” bracket — players here understand the game’s fundamentals but haven’t yet developed the consistency to execute reliably. This is also where the player density starts increasing significantly, peaking in the Archon range just above.
Archon (2,310 — 3,080 MMR)
| Sub-tier | MMR Range | % of Players | Cumulative |
|---|---|---|---|
| Archon 1 | 2,310 — 2,464 | 4.1% | 34.6% |
| Archon 2 | 2,464 — 2,618 | 4.5% | 39.1% |
| Archon 3 | 2,618 — 2,772 | 4.8% | 43.9% |
| Archon 4 | 2,772 — 2,926 | 4.7% | 48.6% |
| Archon 5 | 2,926 — 3,080 | 4.3% | 52.9% |
Archon is the most populated bracket. Nearly 1 in 4 ranked players falls within Archon, making it the statistical center of the Dota 2 population. Games here are characterized by improving mechanical skill but inconsistent decision-making — players know what to do but don’t always do it at the right time.
Legend (3,080 — 3,850 MMR)
| Sub-tier | MMR Range | % of Players | Cumulative |
|---|---|---|---|
| Legend 1 | 3,080 — 3,234 | 4.3% | 57.2% |
| Legend 2 | 3,234 — 3,388 | 4.2% | 61.4% |
| Legend 3 | 3,388 — 3,542 | 4.0% | 65.4% |
| Legend 4 | 3,542 — 3,696 | 3.9% | 69.3% |
| Legend 5 | 3,696 — 3,850 | 3.7% | 73.0% |
Legend is where games start to feel “real.” Players at this level understand power spikes, have decent map awareness, and can execute team fights with some coordination. Legend players are better than roughly 3 out of 4 Dota players — yet many still feel like they’re “average.” This perception gap is one of the most interesting psychological aspects of ranked gaming.
Ancient (3,850 — 4,620 MMR)
| Sub-tier | MMR Range | % of Players | Cumulative |
|---|---|---|---|
| Ancient 1 | 3,850 — 4,004 | 3.4% | 76.4% |
| Ancient 2 | 4,004 — 4,158 | 3.1% | 79.5% |
| Ancient 3 | 4,158 — 4,312 | 2.9% | 82.4% |
| Ancient 4 | 4,312 — 4,466 | 2.8% | 85.2% |
| Ancient 5 | 4,466 — 4,620 | 2.6% | 87.8% |
Ancient is where game knowledge becomes the differentiator. Mechanical skill is generally solid across all players here — what separates an Ancient 1 from an Ancient 5 is understanding draft implications, timing windows, and map control. This bracket also sees the most “stuck” players — people with enough skill to feel they deserve more but lacking the refined decision-making to push through.
Divine (4,620 — 5,420 MMR)
| Sub-tier | MMR Range | % of Players | Cumulative |
|---|---|---|---|
| Divine 1 | 4,620 — 4,780 | 2.0% | 89.8% |
| Divine 2 | 4,780 — 4,940 | 1.8% | 91.6% |
| Divine 3 | 4,940 — 5,100 | 1.6% | 93.2% |
| Divine 4 | 5,100 — 5,260 | 1.5% | 94.7% |
| Divine 5 | 5,260 — 5,420 | 1.3% | 96.0% |
Reaching Divine puts you in the top 10% of all Dota 2 players. At this level, players have strong mechanical skills, good game sense, and understand the meta deeply. The gap between Divine and Immortal is primarily consistency and execution under pressure.
Immortal (5,420+ MMR)
| Sub-tier | MMR Range | % of Players |
|---|---|---|
| Immortal (no rank) | 5,420 — 6,500 | 2.5% |
| Immortal (ranked) | 6,500 — 8,000 | 1.0% |
| Top 1000 | 7,500 — 9,000 | 0.3% |
| Top 100 | 9,500 — 12,000 | 0.05% |
| Top 10 | 12,000+ | 0.005% |
Immortal is not a monolith. The range within Immortal is staggering — a bottom-tier Immortal at 5,500 MMR is as far from a Top 10 player as a Herald is from an Ancient player. The bracket contains professional players, semi-pros, content creators, and dedicated grinders. At the very top, the leaderboard is dominated by players who treat Dota 2 as a full-time job.
Percentile Analysis: Where You Stand
Percentiles give you the clearest picture of where you stand. Here’s a quick-reference table for specific MMR values:
| Your MMR | Medal | Percentile | You’re Better Than… |
|---|---|---|---|
| 500 | Herald 3 | 3rd | 3% of players |
| 1,000 | Guardian 2 | 8th | 8% of players |
| 1,500 | Crusader 1 | 14th | 14% of players |
| 2,000 | Crusader 4 | 25th | 25% of players |
| 2,500 | Archon 2 | 39th | 39% of players |
| 3,000 | Archon 5 | 52nd | 52% of players |
| 3,500 | Legend 3 | 65th | 65% of players |
| 4,000 | Ancient 1 | 77th | 77% of players |
| 4,500 | Ancient 5 | 86th | 86% of players |
| 5,000 | Divine 3 | 93rd | 93% of players |
| 5,500 | Immortal | 96th | 96% of players |
| 6,000 | Immortal | 97.5th | 97.5% of players |
| 7,000 | Immortal | 99th | 99% of players |
| 8,000 | Immortal | 99.5th | 99.5% of players |
| 10,000 | Immortal (Top 100) | 99.95th | 99.95% of players |
The “I’m Stuck in Average” Fallacy
One of the most common complaints in the Dota 2 community is: “I’m stuck at average MMR and can’t climb.” Let’s put this in context:
- If you’re Crusader 5 and feeling “stuck at average,” you’re actually better than 30% of all ranked players. You’re below average.
- If you’re Archon 3, you’re at the true statistical median.
- If you’re Legend 1 and feel “stuck in the middle,” you’re better than 57% of all players. You’re above average.
The perception problem comes from social media and streaming. When you watch Dota content, you see Immortal-level gameplay. This skews your sense of “normal.” In reality, reaching Legend puts you in the top quarter of all Dota players globally — a genuine achievement.
Regional Differences
Rank distribution varies meaningfully by server region. Several factors drive these differences:
Regional Distribution Comparison
| Region | Median MMR | % at Immortal | % at Herald | Notes |
|---|---|---|---|---|
| Europe West | ~2,600 | 4.5% | 3.8% | Largest player pool, most balanced distribution |
| Southeast Asia | ~2,400 | 3.8% | 5.2% | Wide skill range, large casual population |
| China | ~2,800 | 5.2% | 2.9% | Highly competitive, higher average skill |
| North America | ~2,500 | 3.5% | 4.1% | Smaller pool, more volatile matchmaking |
| South America | ~2,300 | 2.8% | 5.5% | Growing scene, lower overall density |
| CIS/Russia | ~2,700 | 4.8% | 3.5% | Strong competitive tradition |
Why China and CIS Have Higher Averages
Regions with strong competitive traditions (China, CIS/Russia, Europe) tend to have higher median MMRs. This isn’t because the game is “easier” there — it’s because:
- Higher proportion of dedicated players — Fewer casual players pulling the average down.
- Internet café culture — In China especially, many players learn in competitive environments from the start.
- Pro scene influence — Regions with successful professional teams inspire more serious play.
- Game longevity — Dota has been popular in these regions for 15+ years (since WC3 DotA), creating a more experienced average player.
What This Means for You
If you play on multiple servers, your MMR will stay the same, but a 4,000 MMR game on EU West may feel different from a 4,000 MMR game on South America due to differences in playstyle, coordination expectations, and the proportion of very high-skill players in the queue.
Historical Shifts (2017-2026)
The Dota 2 rank distribution hasn’t stayed static. Several major system changes have shifted the curve:
Major Timeline Events
| Year | Event | Impact on Distribution |
|---|---|---|
| 2017 | Medal system introduced (replacing raw MMR display) | Cosmetic change; distribution unchanged |
| 2018 | Seasonal resets begin | Slight compression toward the mean each season |
| 2019 | Solo/party MMR merged; Role Queue introduced | Significant redistribution; many players’ ranks shifted |
| 2020 | Smurf detection improvements | Reduction in low-bracket skew from smurf accounts |
| 2021 | Phone verification requirement | Further reduction in smurf accounts |
| 2022-2023 | Ranked reworks and seasonal adjustments | Medal boundaries recalibrated; top-end MMR continued climbing |
| 2024 | Continued anti-smurf measures | Cleaner distribution at lower brackets |
| 2025-2026 | Current system stabilization | Distribution relatively stable; slight inflation at upper brackets |
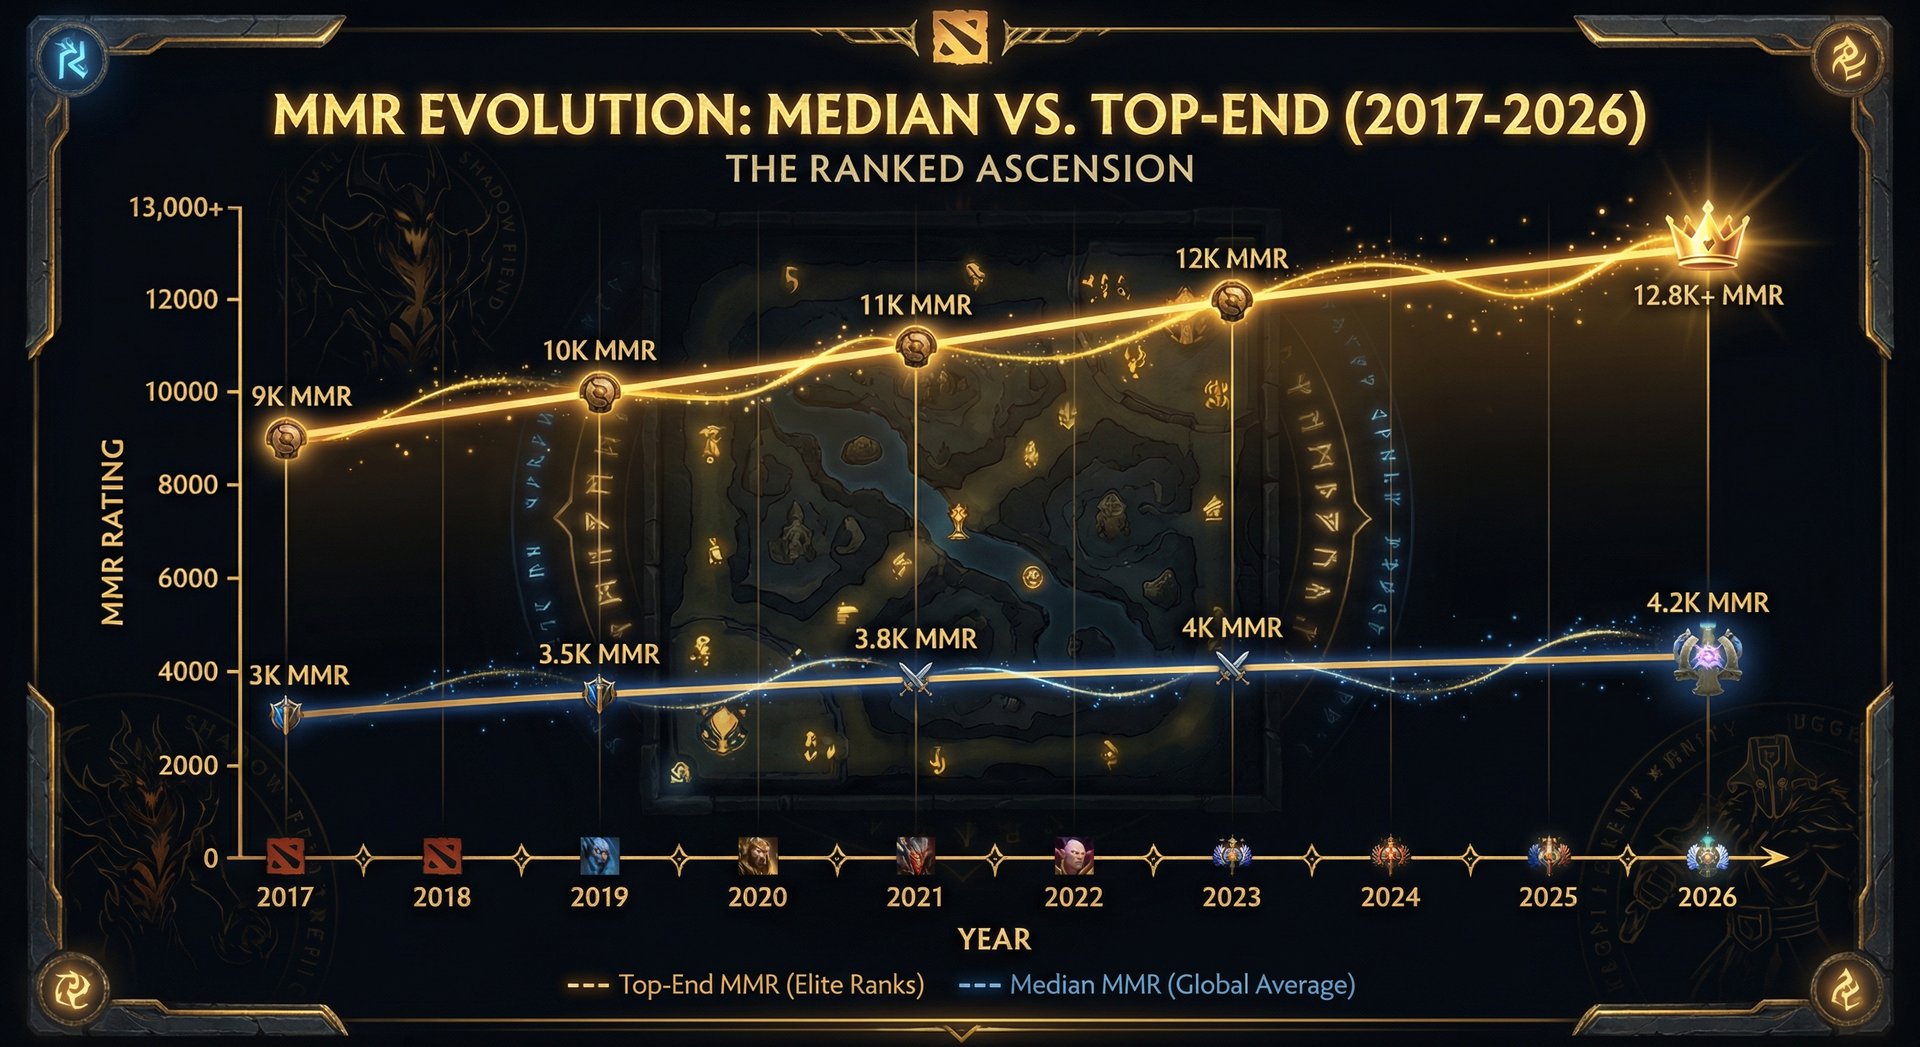
The Long-Term Trend
Over the years, the Dota 2 distribution has experienced slight upward drift at the top end. The very best players continue to push higher MMR numbers — the top MMR has gone from ~9,000 in 2017 to ~13,000+ in 2026. This is partly due to:
- More games played — Players who’ve been grinding for years accumulate MMR.
- System refinements — Better smurf detection means fewer artificially low accounts pulling down the bottom.
- Player improvement — The overall skill level of the Dota 2 playerbase has risen as the game matures. Concepts that were “high-level” in 2015 are now common knowledge at Archon.
What “Average” Really Means
When someone asks “What’s the average rank in Dota 2?”, the answer depends on what kind of average you mean:
Three Definitions of Average
| Type | Value | Medal | Explanation |
|---|---|---|---|
| Mean | ~2,500 MMR | Archon 2 | The arithmetic average of all ranked players’ MMRs |
| Median | ~2,650 MMR | Archon 3 | The middle value — 50% of players are above, 50% below |
| Mode | ~2,600-2,700 MMR | Archon 3 | The most common MMR value (the peak of the bell curve) |
All three measures converge around Archon 2-3 (approximately 2,500-2,700 MMR). So if you’re Archon 3, congratulations — you are exactly average. If that sounds underwhelming, consider this: the average Dota 2 player has likely invested 2,000-4,000+ hours into the game. Being “average” at something with that kind of time investment still represents significant skill and knowledge.
The “Average Active Player” vs. “Average Account”
There’s a meaningful distinction between:
- Average of all accounts with an MMR — This includes dormant accounts, abandoned accounts, and players who calibrated once and never played again. This pulls the average down.
- Average of actively playing ranked accounts — This is higher, because active players tend to be more invested and skilled. The active player average is likely closer to 2,800-3,000 MMR (Archon 5 to Legend 1).
If you’re comparing yourself to “average,” make sure you’re comparing against the right group. Against all accounts, Legend is well above average. Against active, dedicated players who play 5+ games per week, Legend is closer to the median.
The Rank Inflation/Deflation Debate
A perennial topic in the community: Is MMR inflating? Are ranks easier to get now than they used to be?
Arguments for Inflation
- Higher top-end MMR — The maximum recorded MMR has increased from ~9,000 to ~13,000+ over the game’s history.
- Medal boundary changes — Valve periodically adjusts medal boundaries, and players report feeling like their medal represents less skill than it used to.
- Shrinking player base — As casual players leave, the remaining population is more skilled on average, which could push median MMR upward without actual skill improvement.
Arguments Against Inflation (Deflation)
- Seasonal resets compress toward the mean — Each recalibration slightly compresses the distribution, which counters long-term drift.
- Smurf detection removes fake low accounts — Cleaning up the bottom of the ladder could raise the median without inflating the top.
- Zero-sum nature — In theory, MMR is zero-sum (what winners gain, losers lose). New MMR can only enter the system through calibration, and it can exit through abandoned accounts.
The Verdict
The truth is nuanced: there has been slight inflation at the very top (Immortal bracket), while the middle of the distribution has remained relatively stable. The median player’s MMR hasn’t changed dramatically — it’s been in the Archon range for years. What has changed is that the top players have pushed much further from the median, stretching the upper tail of the distribution.
For practical purposes: if you were Ancient 3 in 2020, you’d probably still be approximately Ancient 3 in 2026 at the same skill level. The medals are roughly calibrated to represent the same percentile position across seasons.
Player Population Trends
Dota 2’s concurrent player count affects rank distribution in important ways:
Active Player Estimates (2026)
- Monthly active players: ~7-8 million
- Daily peak concurrent: ~500,000-700,000
- Players with ranked MMR: ~4-5 million estimated
- Actively playing ranked (monthly): ~2-3 million estimated
Population’s Effect on Distribution
A smaller player base has several effects:
- Longer queue times — Especially at extreme MMR values (very high and very low).
- More imbalanced matches — The matchmaker has fewer players to choose from, leading to wider MMR gaps between teams.
- More volatile climbing — Imbalanced matches mean more variable MMR gains, which can lead to faster climbs (or faster drops).
For players looking to climb, this can actually be advantageous — if you’re genuinely better than your bracket, imbalanced matches give you more opportunities to gain extra MMR from “underdog” wins.
What the Data Tells Us About Climbing
Understanding the rank distribution gives you practical insights for climbing:
1. The “Bracket Walls” Are Real
Player density peaks at certain MMR ranges, creating natural “walls” where climbing slows:
- Crusader 5 to Archon 1 (~2,200-2,400) — The “breaking into average” wall. High player density means every game is competitive.
- Legend 5 to Ancient 1 (~3,800-4,000) — The “breaking into good” wall. Players here have solid fundamentals; you need something extra to push through.
- Divine 5 to Immortal (~5,300-5,500) — The “breaking into elite” wall. Competition is fierce, and small mistakes are severely punished.
2. Each Medal Gets Exponentially Harder
Moving from Herald to Guardian requires beating the weakest ~5% of players. Moving from Ancient to Divine requires beating players in the top 12-4%. The skill gap between each tier is not linear — it increases exponentially as you climb.
3. The Fast Track: Services and Coaching
For players who want to break through bracket walls without grinding hundreds of games, two options stand out:
- MMR Boosting — Skip the wall entirely and start playing at your target bracket. Best for players who’ve already improved but are stuck in games that don’t reflect their current skill.
- Professional Coaching — Identify the specific skills holding you back and develop them with expert guidance. Best for players who want sustainable improvement.
- Calibration Service — Maximize your seasonal reset to start from a higher baseline. Especially effective after system resets.
For a deeper dive into MMR mechanics, read our complete guide to how MMR works. And for specific hero picks optimized for climbing, check our 2026 hero tier list.
Frequently Asked Questions (FAQ)
Ready to Climb? Start Your Boost Today
Team Smurf is the #1 rated Dota 2 boosting service in 2026. Immortal-rank boosters, maximum safety, competitive pricing, 24/7 support.
Conclusion
The Dota 2 rank distribution tells a clear story: most players cluster around Archon, with the population thinning rapidly at higher ranks. If you’re Legend, you’re already well above average. If you’re Ancient, you’re in elite territory. And if you’re Immortal, you’re among the best in the world at one of the most complex competitive games ever made.
Understanding where you sit in the distribution is the first step toward setting realistic goals. If you’re Crusader aiming for Ancient, you need to surpass roughly 57% of the playerbase — a significant but achievable goal with focused practice and the right guidance.
Wherever you are on the curve, TeamSmurf is here to help you move up. Whether through direct MMR boosting, calibration optimization, or personalized coaching, we have solutions for every bracket and every goal.
For a deep dive into how the MMR system actually calculates your rank, read our companion guide: Dota 2 MMR Explained: The Complete Technical Guide.
Written by Team Smurf’s Immortal-rank analysts — Rankings last verified February 2026


